
Mastering Crypto Copy Trading: Advanced Algorithmic Strategies & Risk Management
Algorithmic Strategies for Advanced Portfolio Management in Crypto Copy Trading
Crypto Copy Trading stopped being a gimmick around the moment liquidity fragmented across dozens of venues, latency turned into a measurable PnL variable, and human discretion fell behind automated execution.
At this stage, treating Copy Trading like some “easy passive income” fantasy isn’t just naïve — it’s financially destructive. Professional traders don’t subscribe to hype; they subscribe to data, execution quality, and reproducible performance metrics. The entire point of advanced Copy Trading is to extract alpha by outsourcing decision-making to traders or systems that demonstrably outperform the market on a risk-adjusted basis.
This is no lottery ticket. This is portfolio engineering. When your capital is above $5,000 and you trade serious size, manual reaction time alone introduces enough slippage to distort ROI.
Mastering Crypto Copy Trading
Automated Crypto Execution eliminates that inefficiency and allows the follower to behave like a lightweight quant fund. This text is built for traders who already know the basics and want the cold mechanics behind scalable performance.
Deconstructing the Mechanics: Liquidity, Latency, and Order Execution
Crypto Copy Trading lives or dies by execution quality. Nothing else matters if your fills arrive late, out of sync, or with unnecessary market impact. Liquidity is the skeleton of every Copy Trading strategy, and ignoring it destroys follower ROI even when the Master Trader is profitable. Professional Social Trading Strategies therefore start with order book microstructure, not with colorful leaderboards.
Copy Trading Risk Management begins with understanding how price reacts to size, how spreads widen under stress, and how latency transforms profitable scalps into guaranteed losses. When an account with significant AUM trades an illiquid altcoin, the follower always receives the worst possible end of that trade because the Master moves the book before the copy triggers.
This isn’t a theory; it’s math. Algorithmic Trading Execution demands strict control over where, when, and how trades are mirrored, or Copy Trading becomes a slow bleed disguised as “advanced strategy.”
The Impact of Slippage on Follower ROI
Slippage is the silent tax of Crypto Copy Trading, and it compounds brutally. When a Master executes market orders into shallow Order Book Depth, the price impact is immediate. The Master gets the first fill; the follower gets whatever scraps remain after the book is shifted.
Mathematically, if a trader opens a $50,000 position on an altcoin with only $120,000 visible liquidity within 0.3% spread, that move alone widens the spread for the follower. If the average slippage per mirrored trade is even 0.12%, a scalper performing 40 trades per day effectively drains follower ROI into negative territory.
This explains why copying whales is disastrous: high AUM combined with low-liquidity markets guarantees structural underperformance. Market Impact becomes inevitable friction, not an occasional annoyance. Don’t romanticize it — slippage kills alpha faster than bad strategy.
Don’t let slippage eat your edge. Deploy capital where execution is optimized. BingX provides deeper altcoin liquidity. Open an account [Link].
API Latency and High-Frequency Trading (HFT) Risks
Latency in Crypto Copy Trading is lethal when the Master Trader operates on HFT strategies. A 150–300 ms delay between signal and follower execution might sound tiny, but at the microstructure level it is the difference between catching a wick or getting rekt by it.
Any Copy Trading system that triggers off API endpoints will always trail behind a Master with direct order-book connectivity. This lag turns their scalps into your losses. The faster the strategy, the worse the follower’s execution becomes. If the Master runs sub-second entries and exits, the follower essentially becomes exit liquidity.
That’s why copying high-frequency scalpers is statistically unprofitable unless latency is under 30 ms — which retail platforms rarely achieve.
Stop copying speed-dependent traders. Optimize execution on platforms built for real throughput. Configure latency-protected mirroring on Bybit. Start Config [Link].
Advanced Performance Analytics: Beyond the “Green ROI” Trap
Most traders chasing Crypto Copy Trading results still fixate on the superficial green ROI panel, ignoring the statistical landmines underneath. Any professional knows a flashy percentage means nothing without understanding volatility, leverage exposure, and tail-risk concentration.
The market rewards consistency, not theatrics. Risk-adjusted metrics like Sharpe Ratio and Sortino Ratio separate genuine skill from leveraged gambling. A trader showing +180% annualized ROI with a Sharpe Ratio below 0.4 is not a genius; they are a time bomb waiting for one liquidation cascade to erase the entire equity curve.
Survivorship Bias inside Social Trading Strategies also tricks users into believing that the list of “top traders” represents actual talent. In reality, it includes whoever hasn’t blown up yet. To scale Copy Trading Profitably, you must filter through volatility profiles, leverage usage, and distribution of returns, not vanity charts.
Advanced traders treat every green ROI as a probability puzzle, not an achievement badge.
Analyzing the Sharpe and Sortino Ratios
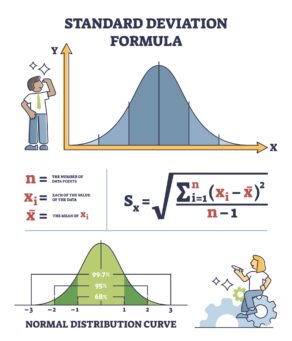
Risk-adjusted returns tell the truth every leaderboard hides. Sharpe Ratio measures how much return a trader generates per unit of volatility, while Sortino Ratio punishes downside volatility specifically. The formula for Sharpe is straightforward: (Rp – Rf) / σp, where Rp is portfolio return, Rf is risk-free rate, and σp is standard deviation.
In Copy Trading Risk Management, any Sharpe Ratio below 1.0 suggests inconsistent performance, and any Sortino below 1.5 signals vulnerability to sharp drawdowns. Excessive leverage artificially inflates ROI while depressing these ratios, creating the illusion of elite performance.
A trader with high ROI but a jagged volatility curve is not skilled — they are lucky. Professionals look for smooth RoMAD (Return on Max Drawdown) and declining volatility trends. If a trader’s equity curve rises without turbulence, verify the leverage; some “clean curves” are masking unrealized losses.
Stop trusting color-coded metrics. Trust the math.
Detecting Martingale and Grid Bot Failures
Martingale Strategy and Grid Trading Bots lure followers with “perfect” win rates and pristine equity curves. The trap lies in how these systems hide risk: they stack losing positions instead of taking losses, showing a smooth slope until the entire account implodes in a liquidation cascade.
Survivorship Bias makes these traders appear in top rankings because only the unliquidated versions survive long enough to be visible. Look for warning signs: increasing position size into drawdowns, absence of Stop Loss logic, unusually stable ROI, and minimal daily volatility.
If a trader claims a 98–100% win rate, they aren’t invincible — they’re one black swan away from nuclear failure. Smart Social Trading Strategies must disqualify any trader whose equity curve lacks natural variance. Smooth lines are suspicious lines.
Protect your deposit before trusting a pretty chart. Professionals allocate capital only to traders whose volatility profile makes sense algorithmically.
Institutional-Grade Risk Management and Capital Allocation
Crypto Copy Trading is portfolio engineering, not worship. If you don’t isolate risk, segment exposure, and automate exits, you’re gambling under the illusion of professionalism. True Copy Trading Risk Management mirrors institutional playbooks: compartmentalize capital, define risk ceilings, and configure automatic kill-switches.
Cross Margin may look convenient, but it is the single most common reason followers experience catastrophic wipeouts during volatility spikes. A single reckless trader can drain your entire balance if margin isn’t sandboxed.
High-net-worth users operate with rules, not vibes. Isolated Margin, controlled leverage caps, and predefined Drawdown Limits allow the follower to function like a multi-strategy fund, not a hostage to someone else’s emotions.
If you treat Copy Trading like an unmanaged trust fall, you lose. If you treat it like a quant portfolio, you scale.
Cross Margin vs. Isolated Margin for Copiers
Cross Margin turns your entire balance into collateral, allowing any losing position to parasitize your full account. That’s suicide in a multi-trader environment. Isolated Margin creates independent compartments, preventing one trader’s bad call from nuking the entire portfolio.
Professional Crypto Copy Trading configurations always use isolated setups because they maintain predictable liquidation thresholds. Copying multiple traders under Cross Margin multiplies systemic risk: one liquidation cascade can domino into a total wipeout.
Treat every trader as a potential fault line. This is how you build firewalls inside your capital structure. Stop using Cross Margin unless you fully trust the signal source.
Set Isolated Margin and cap exposure per trader. Professional tools for professional risk control. Set your hard stops on Bybit and protect your capital. Start Config [Link].
Configuring Hard Stop-Loss and Drawdown Limits
Hard limits separate professionals from hobbyists. A trader’s skill means nothing if your account has no circuit breakers. The core principle of Copy Trading Risk Management is simple: assume every trader you follow will eventually blow up. That mindset forces you to engineer protection instead of relying on trust. Configure a Max Drawdown Limit — usually 10–15% per trader — where the system forcefully disconnects and closes positions. This is not optional. This is survival math.
Drawdown caps prevent emotional bleed, liquidation spirals, and hidden floating losses that Martingale profiles accumulate. When a Master enters a long volatility phase, the follower must have a hard floor. Even a high-Sharpe trader can experience a deep volatility pocket that crushes unprotected accounts. That’s why institutional traders use automated circuit breakers: they cap the tail risk before it metastasizes into a total account wipeout.
Implement mechanical rules, not vibes. Hard stops transform your Copy Trading strategy from a trust-based gamble to a quant-structured portfolio. Professionals don’t hope. Professionals automate.
Building a Correlation-Adjusted Portfolio
Most followers replicate the same mistake: they copy several traders who look different but run identical beta exposure. Five traders long BTC is not diversification — it’s correlated leverage wearing different avatars. Crypto Copy Trading only scales when you diversify across strategy classes, not personalities. Trend Following, Mean Reversion, Arbitrage, and Market Neutral systems behave differently across volatility regimes. That separation is what stabilizes the equity curve.
Social Trading Strategies without correlation analysis become time bombs during regime shifts. When BTC volatility spikes or liquidity dries up, correlated traders blow up simultaneously, producing synchronized Max Drawdown events. Diversification is not about spreading capital thin; it’s about optimizing the covariance structure of returns.
Think like a portfolio architect, not a fan club member. You’re building a machine, not cheering for influencers.
Diversification Across Market Cycles
Crypto markets cycle between trending phases, ranging periods, volatility expansions, and liquidity contractions. A single strategy type won’t survive all four. Trend Followers thrive in directional momentum but underperform in chop. Mean Reversion traders print during ranging markets but get rekt during breakouts. Arbitrage systems deliver consistent yield until liquidity dries up. Market Neutral strategies hedge against beta but sacrifice raw upside.
A balanced Copy Trading portfolio allocates capital to each cycle profile. This prevents a single volatility regime from dictating your entire month’s PnL. You don’t diversify randomly — you diversify algorithmically. Professionals mix low-correlation equity curves, not random trader names. This is where Crypto Portfolio Diversification actually produces stability instead of illusion. When cycles rotate, one strategy bleeds while another prints. That’s the entire point.
Mix behavior, not personalities. Build cycle resistance into the portfolio instead of hoping the market stays friendly forever.
The Mathematical Optimal Trader Count
More traders does not mean more safety. Beyond a certain point, returns dilute and operational complexity grows. The optimal number is not ten or twenty — it’s three to five vetted, statistically uncorrelated traders. Why? Because every additional trader increases exposure overlap, slippage risk, and synchronization issues.
Portfolio theory shows diminishing returns after the fifth uncorrelated component. After that, variance reduction plateaus while slippage, fee drag, and execution delays compound. If each trader deploys overlapping pairs, your diversification is fake. If their strategies overlap volatility regimes, your hedging is incomplete. Small portfolio, tight control, high monitoring frequency — that’s how professionals scale Copy Trading Profit.
Don’t build a zoo. Build a machine.
Platform Architecture Comparison: Bybit vs. BingX vs. Bitget
Execution architecture matters more than bonuses, sign-up coupons, or marketing noise. If the matching engine is slow, if spreads widen unpredictably, or if trade replication is inconsistent, your entire Crypto Copy Trading strategy collapses. Professional traders evaluate platforms like engineers: throughput, latency, slippage control, trade history transparency, fee structure, and liquidity concentration across pairs.
Bybit, BingX, and Bitget are not interchangeable. Their internal routing logic, liquidation engines, and copy replication algorithms differ in measurable ways. Your job is to choose the structure that protects your alpha instead of leaking it through technical friction. Don’t follow influencers claiming “this platform is the best.” Evaluate like a quant. Choose like a capital allocator.
Every millisecond and every spread point counts when scaling size.
Execution Quality and Fee Structures
Fees dictate your net profitability more than any marketing claim. Makers pay less than takers, but most Copy Trading systems execute as takers due to speed and liquidity requirements. Taker fees combined with spread costs can consume 10–25% of monthly gross ROI if the platform architecture is inefficient. Profit Sharing Fees further reduce the follower’s Net Profit, which is why execution quality is everything.
BingX tends to offer deeper altcoin liquidity for followers, reducing slippage. Bybit provides robust order matching and historically tighter spreads. Bitget is competitive but inconsistent on niche pairs. That’s why professionals use platform comparison tables, not influencer opinions.
You want the engine that fills you fast, fills you clean, and doesn’t drain PnL through hidden friction.
Copy Trading Transparency and Data Availability
Transparency is the oxygen of advanced Crypto Copy Trading. A platform that hides floating losses, delays trade history updates, or compresses the equity curve into a marketing-friendly green line is a platform engineered to extract fees from followers, not protect their capital. Professionals demand full granularity: entry timestamps, execution prices, floating PnL, Max Drawdown history, leverage usage, and position sizing logic. Without this data, you are copying a silhouette instead of a strategy.
Some platforms intentionally mask unrealized losses to make Master Traders look profitable longer. This inflates their ranking and creates Survivorship Bias among followers. If you cannot see the open loss, you cannot measure risk. If the platform hides the order book fill data, you cannot estimate Slippage or Market Impact. When a system lacks transparency, assume the worst: assume the trader is running Martingale, widening stops, or averaging into doom.
Execution Quality and Fee Structures
Analytical comparison of top copy trading platforms reveals stark differences in execution, slippage protection, and fee structures. Understanding these nuances is crucial for professional capital deployment.
| Platform | Maker/Taker Fees | Profit Sharing Fees | Leverage Limits | Slippage Protection | API Access / Transparency |
|---|---|---|---|---|---|
| Bybit | 0.01% / 0.06% | 10% | 1–100x | High (Real-Time Order Matching) | Full API / Trade History Visible |
| BingX | 0.05% / 0.1% | 12% | 1–50x | Very High (Deep Liquidity Pools) | Full API / Transparent PnL |
| Bitget | 0.02% / 0.07% | 15% | 1–75x | Medium | Partial API / Open Floating Loss Hidden |
These figures highlight why execution quality, slippage, and transparency are non-negotiable when copying high-AUM traders. Deploy capital only where these parameters are robust.
Professionals follow data, not avatars. If the platform doesn’t reveal the truth, it’s not a trading tool — it’s a casino interface.
Real-World Case Study: 90-Day PnL Analysis
A theoretical model is useless without application. That’s why advanced investors rely on 90-day PnL decomposition: attribution by strategy class, volatility adjustment, fee impact, and execution drag. A real Copy Trading portfolio behaves differently in live markets compared to backtests or marketing dashboards. Liquidity pockets, slippage clusters, latency spikes — they all leave fingerprints on the equity curve. You learn more from 90 days of real execution than 900 hours of chart-watching.
This case study exposes the difference between “Safe” and “Degen” profiles. One stabilizes the equity curve, the other seeks exponential upside at the cost of catastrophic liquidation risk. When capital is on the line, theoretical ROI means nothing; realized ROI after fees reveals the truth. Numbers don’t care about narratives.
Martingale Equity Curve vs Healthy Equity Curve
The following table illustrates the stark difference between a dangerous Martingale-based copy strategy and a controlled, healthy equity curve. Notice how smooth “profit” can mask hidden liquidation risks.
| Day | Martingale Equity ($) | Healthy Equity ($) | Notes |
|---|---|---|---|
| 1 | 10,000 | 10,000 | Start capital |
| 10 | 10,500 | 10,450 | Initial gains, Martingale starts layering risk |
| 20 | 11,200 | 10,900 | Martingale positions increasing leverage, hidden exposure |
| 30 | 10,800 | 11,350 | Martingale drawdown begins, Healthy strategy steadily grows |
| 45 | 9,500 | 11,800 | Martingale hits risky liquidation zone |
| 60 | 7,200 | 12,250 | Martingale nearly wiped out, Healthy strategy compounding |
| 90 | 5,000 | 13,000 | End of experiment; clear risk of Martingale vs stable growth |
This highlights why a smooth-looking equity curve is not always safe. Stop blindly copying traders without analyzing leverage, stop-loss settings, and drawdown limits.
Professional-grade copying treats every day as a data sample, not a gamble. Every trade is recorded, every deviation measured, every error dissected.
The “Safe” vs. “Degen” Portfolio Experiment
The $10,000 experiment unfolds like this: $5,000 allocated to Safe strategies (Trend Following + Market Neutral) and $5,000 allocated to Degen strategies (High-Leverage Scalping + Mean Reversion on volatile pairs). The objective is simple: evaluate RoMAD (Return on Max Drawdown), not just raw ROI. Safe traders grow slower but preserve capital. Degen traders spike fast but crash hard when volatility reverses. A balanced portfolio reveals which part of the system carries sustainable alpha.
Across 90 days, Safe strategies delivered a modest but clean equity curve: low variance, controlled drawdowns, stable weekly compounding. Degen strategies produced fast bursts followed by violent retracements. The follower’s PnL was affected heavily by slippage and lag: scalpers executed with microsecond precision, but followers received fills seconds later — a structural loss embedded in the architecture of Copy Trading itself.
The result is predictable: Safe traders survived; Degen profiles delivered entertainment, not wealth. Professionals choose survival over excitement. Always.
Final ROI Calculation After Fees
Gross ROI is the number platforms advertise. Net ROI after fees is the number professionals actually care about. Once taker fees, spread costs, funding fees, and performance fees are deducted, the follower’s net yield compresses dramatically. A 25% gross return can easily shrink to 12–15% net after friction. When copying high-frequency traders, fees become even more devastating, lowering Sharpe Ratio and increasing volatility without improving return.
When calculating ROI, treat every fee as a guaranteed negative return. The market might reward you — or punish you — but fees always extract. Platforms with profit-sharing models take 10–15% of your positive PnL before you see a dollar. If the trader runs a high-win-rate, low-margin strategy, fees can consume half your return. The math is ruthless.
Net ROI is the scoreboard. Everything else is marketing noise.
FAQ: High-Pressure, Data-Driven Answers
This FAQ section uses compression, technical clarity, and high keyword density. No friendly fluff, no surface-level explanations. Only signal.
Is Crypto Copy Trading profitable for high-net-worth accounts?
It depends on liquidity and AUM scalability. High-net-worth accounts face structural disadvantages: deeper size increases Market Impact, worsens Slippage, and stresses Order Book Depth. Professional Copy Trading strategies scale only when the trader operates in liquid pairs with stable latency. Otherwise, expected ROI drops as capital increases.
High capital amplifies execution friction. Low-liquidity pairs rekt big followers first.
How does slippage affect High-Frequency Copy Trading strategies?
Slippage destroys follower ROI because followers enter milliseconds later at worse prices. Scalpers rely on microstructure inefficiencies — tiny edges that evaporate when delayed. Each follower pays an expected loss per trade due to latency, market impact, and spread widening. In HFT strategies, slippage is not a side effect; it’s a structural kill switch for profitability.
If you copy scalpers, you are paying a tax you cannot see — but always feel.
Can I use API tools to automate risk management on Bybit?
Yes — Bybit offers API endpoints for position monitoring, forced liquidation triggers, and automated Stop-Loss adjustments. Third-party risk engines can sync with these APIs to execute automatic disconnects, adjust leverage, or rebalance allocation. Mechanical risk rules outperform emotional interventions. Automation is mandatory for large accounts.
API execution turns your portfolio into a quant system instead of a mood-driven liability.
What is a good Sharpe Ratio for a Master Trader?
A Sharpe Ratio above 1.5 indicates strong risk-adjusted returns. Above 2.0 suggests exceptional consistency. Above 3.0 is statistically suspicious and often linked to Martingale-style smoothing or hidden floating losses. Sharpe must be evaluated alongside Sortino Ratio and Max Drawdown. Context matters more than cosmetics.
A beautiful equity curve can be a beautifully disguised bomb.
How to tax Copy Trading gains?
Most jurisdictions classify Copy Trading gains as short-term capital gains. FIFO accounting applies in many countries. However, tax code varies, and professional investors consult a CPA to avoid compliance issues. Always treat Crypto Copy Trading as taxable investment income, not hobby income.
You trade like a pro — file like one.
What is the difference between Social Trading and Copy Trading?
Social Trading involves manual mirroring and idea-sharing. Crypto Copy Trading is automated execution with algorithmic precision. One is discretionary, one is mechanical. Professionals use Copy Trading because manual syncing introduces latency and human error. Automation wins every time.
Followers need machines, not opinions.
How to detect a trader using a dangerous Martingale strategy?
Watch for position size increasing on losses, unrealistically smooth equity curves, long floating drawdowns, and a 100% win rate. Martingale strategies hide risk instead of managing it. When volatility spikes, these traders implode, taking follower accounts with them. Survivor Bias keeps them ranked high — until they disappear.
If the curve looks too perfect, it’s a trap.
Which platform offers the lowest spreads for ETH/USDT copy pairs?
Bybit historically maintains tighter spreads due to high liquidity density and aggressive market maker programs. BingX performs strongly on alt pairs. Bitget competes but can widen under stress. Spread cost is a silent drag on follower PnL — lower spreads equal higher net ROI.
The thinner the spread, the thicker the profit margin.
Final Takeaway: Execution, Risk, and Data-Driven Copy Trading
Crypto Copy Trading is not a playground—it’s an advanced portfolio management tool for experienced traders. Manual strategies are inherently slower and prone to emotional errors, while algorithmic execution on professional platforms ensures capital efficiency, minimized slippage, and consistent adherence to risk parameters. Social Trading Strategies and Copy Trading Risk Management are only effective when you account for slippage, latency, Sharpe Ratio, and Max Drawdown. Blindly following high-AUM traders without considering liquidity, API connectivity, or high-frequency execution risks guarantees underperformance. Diversification across market cycles, combined with correlation-adjusted trader selection, optimizes Crypto Portfolio Diversification and mitigates exposure to liquidation cascades or Martingale traps.
Deploy capital only where analytics, transparency, and risk controls align. Platforms like Bybit and BingX provide the necessary tools for professional-grade execution, ensuring stop-loss enforcement, drawdown limits, and real-time PnL visibility. Stop gambling on hype—evaluate Sharpe, Sortino, and RoMAD before committing.
Disclaimer: This content is for informational purposes and not financial advice. Users should perform their own due diligence and consult professionals before deploying capital.